ImmunoSpot® Software

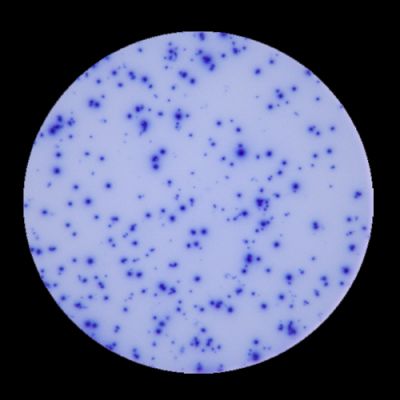
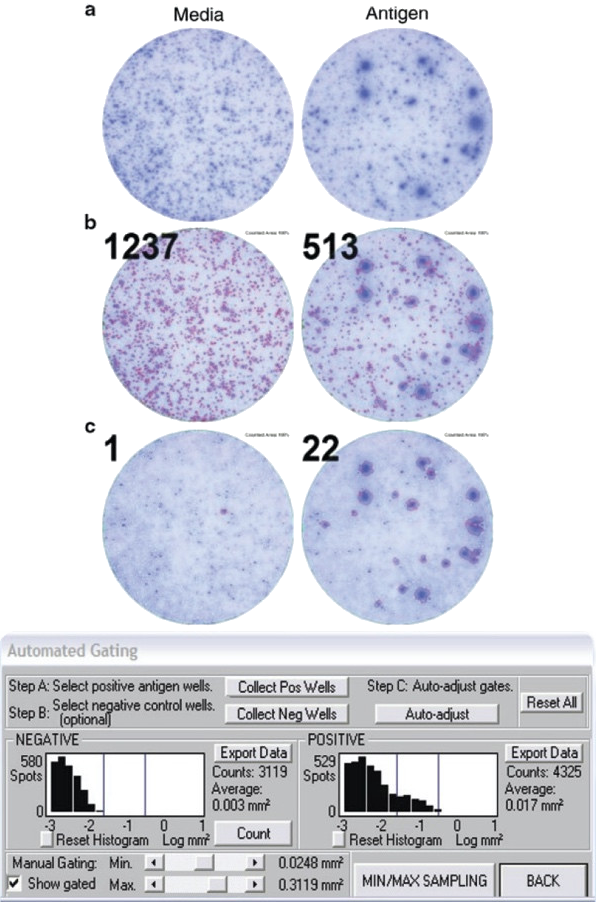
Figure 2. Application of spot size gating for analysis of T cell ELISPOT results, here IFN-γ assay. In the top row (a) well images are shown for a test subject's PBMC with the media (negative) control well on the left, and a well containing the antigen on the right. In this test subject, like frequently in clinical samples, cytokine storms occurred resulting in a high medium IFN-γ background. Such background spots, produced by cells of the innate immune system are smaller than the antigen-induced spots produced by T cells. The scope of counting is to distinguish between the background spots and the antigen-induced spots, and to do so in an objective fashion. Counting all spots results in meaningless numbers (see mid panel, b). In the lower panel, c, the counts and overlays of counted spots with red outline) are shown after proper gating, using the ImmunoSpot® Software’s automated algorithm. The spot size/density distribution for the background spots is established, see the histogram on the left, and this is compared to the histogram of spot size/density distributions in the antigen-triggered well, see histogram on the right. The size/density distribution of spots exceeding the background distribution are subject to automated statistical analysis based upon which the upper and lower gates for counting are set automatically by the AutoGate™ function, assuming a log normal spot size/density distribution. We will detail in the following why the log normal assumption is valid for the scientific basis of objective gating and counting.
Figure 2 illustrates the challenge of T cell ELISPOT counting. In clinical samples, for example in IFN-γ ELISPOT assays, PBMC can exhibit substantial media background. This background is generated by cells of the innate immune system, in particular, activated macrophages and NK cells. Such background is elevated in diseased individuals undergoing cytokine storms. These spots are relatively small, compared to the signature of antigen-activated T cells. The scope of ELISPOT counting is to distinguish between this background noise and the antigen-induced T cell-derived spots, and to do so in an objective, reproducible way. This is done much like it would be done in flow cytometry. Counting spots without gating, as shown in the middle panel of Figure 2b, produces nonsensical numbers, much like flow cytometry results would without gating. With proper gating, however, the numbers of antigen-specific T cells can be identified (see lower panel, Figure 2c). In the following, we describe the scientific evidence that suggests that such gating can be done in an objective and scientifically-validated manner. CTL’s scientists, under the direction of Professor Paul V. Lehmann, have contributed over 200 publications to the field of ELISPOT research (see) helping among other contributions to establish the rules for accurate automatic counting of antigen-specific T cell ELISPOT assays. Highlights are summarized in the following. In essence, the counting parameters are set automatically by the AutoGate™ function of the ImmunoSpot® Software, assuming a log normal spot size/density distribution for T cell derived spots. Here we will detail why the log normal assumption is valid for the objective counting of T cell ELISPOT assays.
The ELISPOT signature of cloned individual T cells
CTL’s initial efforts focused on studying the secretory signature of defined T cell populations, i.e., T cell clones. Such studies revealed a wide dynamic range in both the sizes and intensities of spots detected [ref], (see Figure 3, extracted from that publication), that however followed a close to perfect log-normal size distribution. Importantly, it was necessary to count the full range of spots sizes per well to detect all T cells seeded into the well.

Figure 3. Secretory signature of a T cell clone reveals log normal ELISPOT size distribution. Even T cells with a uniform specificity, that are activated on a clonal population of antigen presenting cells (APC), and at a single concentration of peptide antigen, this wide range of spot sizes are generated that, as a population, however, follow a log-normal size distribution.
The ELISPOT signature of ex vivo isolated primary T cells
Follow-up studies focused attention on the less-defined, but more relevant, scenarios of cytokine signatures from T cells as seen in “normal ELISPOT assays”, studying cells from freshly isolated samples. We undertook a systematic study to verify whether log-normal size distributions were the rule in T cell ELISIPOT assays [ref]: we studied the spot morphologies of IFN-γ, IL-2, IL-4, IL-5 and IL-17 spots from ELISPOT assays using PBMC isolated from 172 healthy human donors following stimulation with 32 individual viral peptides representing defined HLA Class I-restricted epitopes for CD8 cell recall, and with protein antigens of CMV and EBV, activating CD4 cells. A total of 414 T cell recall responses were analyzed. In 99.7% of these cases, spot sizes followed log-normal distributions, firmly establishing log normal size distribution as a general rule for human T cell ELISPOT assay analysis.
Statistics-based objective ELISPOT counting
The above observations establishing log-normal spot size distribution as the rule in T cell ELISPOT assays allows the application of classic parametric statistics for objective ELISPOT counting [ref]. When spot sizes (in log scale) for a given T cell population are normally distributed, it follows that each spot within 3 SD of the mean is derived, with 99.73% probability, from an individual antigen-specific T cell, and should be counted as such. Spots that are 3 SD below the mean spot size for a given assay are, with 99.73% probability, caused by non-T cell bystander cytokine secretion, or by artifacts, and should be excluded from being counted, as they are when using the ImmunoSpot® AutoGate™ function. Spots above the maximum size gate (> 3 SD above the mean spot size) are, with equivalent certainty, not produced by individual T cells, but rather result from cell clusters, and need to be counted as such. In this case, the Immunospot® Software automatically estimates the number of average sized individual spots required to form the oversized cluster in question, and the calculated number is included in the count for that well. ImmunoSpot® automatically establishes spot size distributions for both medium background (negative control) and antigen test wells, relying on user input and machine-learning tools to guide the statistical analysis for determining the minimum and maximum size gates. In this way, ImmunoSpot® provides objective, user-independent analysis of ELISPOT assays.
User- and ImmunoSpot® Reader- independent reproducibility of T cell ELISPOT counts
Nine independent laboratories were given, in turn, the exact same ELISPOT plate, which displayed a wide range and variance of spot counts between wells. These labs used their own ImmunoSpot® Readers (including different models) for image acquisition, but when relying on the SmartCount™ function (that includes SmartSpot® for objective setting of the counting parameters and SmartGate™ for objective gating) they all obtained essentially identical counts [ref].
For those who believe that subjective manual setting of counting parameters by experts might yet be more suitable for optimal counting, we would like to draw attention to a figure of the above publication that is reproduced here as Figure 4. In it, the ELISPOT experts in each of the nine laboratories were asked to recount the plate, but manually adjusting the counting parameters in an attempt to improve the accuracy of the machine-generated counts. Unsurprisingly, these subjectively counted results showed considerable inter-lab variation. However, the mean of the nine subjective counts corresponded precisely to the results generated by the ImmunoSpot® Software, that is, the latter corresponded to the consensus count of that subjectively established by the experts.

Figure 4. Comparison of counting results obtained from subjective/manual determination of counting parameters by 9 expert ELISPOT laboratories vs. the SmartCount™ statistics-based automated results generated by the ImmunoSpot® Software. The latter are shown in the thick black line. Results from the subjective counts are shown in grey with symbols to differentiate each of the 9 participating labs. Note that for each well the subjective counts for any given lab consistently either over- or under-estimate the counts generated automatically by SmartCount™. Also note that the automated results (in black) are close to identical for the 9 laboratories and correspond very closely to the average of all 9 subjective spot counts form all participating laboratories.
Advanced Quality Control features of the ImmunoSpot® Software
The statistics-based counting features described above enable objective automated counting. Over the ImmunoSpot® Software's > 25-year continuous evolution, numerous modules have been added to accommodate the increasingly complex daily challenges encountered in high-throughput ELISPOT data analysis, for both regulated and academic studies. For example, there are dedicated Quality Control tools available that account for individual variations of spot size distributions, e.g., in samples from patients undergoing immunotherapy (Verify Gate™ function), as well as to document and account for complications in physical assay performance, such as leaking wells or high/variable background in assay wells.
Learn more about the regulatory compliance of the ImmunoSpot® Software.
Learn more about multi-color counting with CTL’s FluoroX Software.